The Swiss quantify everything, even start-ups’ mortality
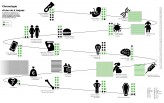
All aspects of life are subject to probability calculus, something that can be clearly seen in this infographic inspired by the Isotype model.
SwissInfographics
July 5, 2016
Everybody knows that Swiss people are obsessed with precision. This country’s traditions are deeply rooted in measurement and quantification, so much that one can find statistics about every single aspect of existence.
For instance, it has been calculated that the chances for a Swiss start-up to reach the three-year mark are only 2/10. This infographic, originally published in Hémisphères magazine, shows some of the probabilities for a female individual in Switzerland to experience more or less common happenings in her life, from the most serious reproductive choices through the oddest hazards to the darkest times.
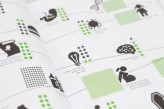
What is interesting about the chart is that, thanks to its curved line and difference from traditional timelines, this chronology optimizes the space in the page. It is inspired by the Isotype (International System of TYpographic Picture Education) method, invented in the 1920s by Austrian philosopher Otto Neurath and German graphic designer Gerd Arntz. It transfers most of the information through images, thus reducing the need for text to minimum.
Design: LargeNetwork, Benoit Ecoiffier
Journalist: Julien Calligaro
Originally appeared in: Hémisphères Volume XI
Date: June 2016
Sources: OFS, Universities of Fribourg, Lausanne, Bern and Zurich, Dialogai, State of the World’s Mothers Report 2014, Groupement hospitalier de l’Ouest lémanique, Groupement Romand d’Études des Addictions, National Institute for Cancer Epidemiology and Registration, SanteRomande.ch, EuroMillions, FRAGILE Suisse.


